An invitation to play
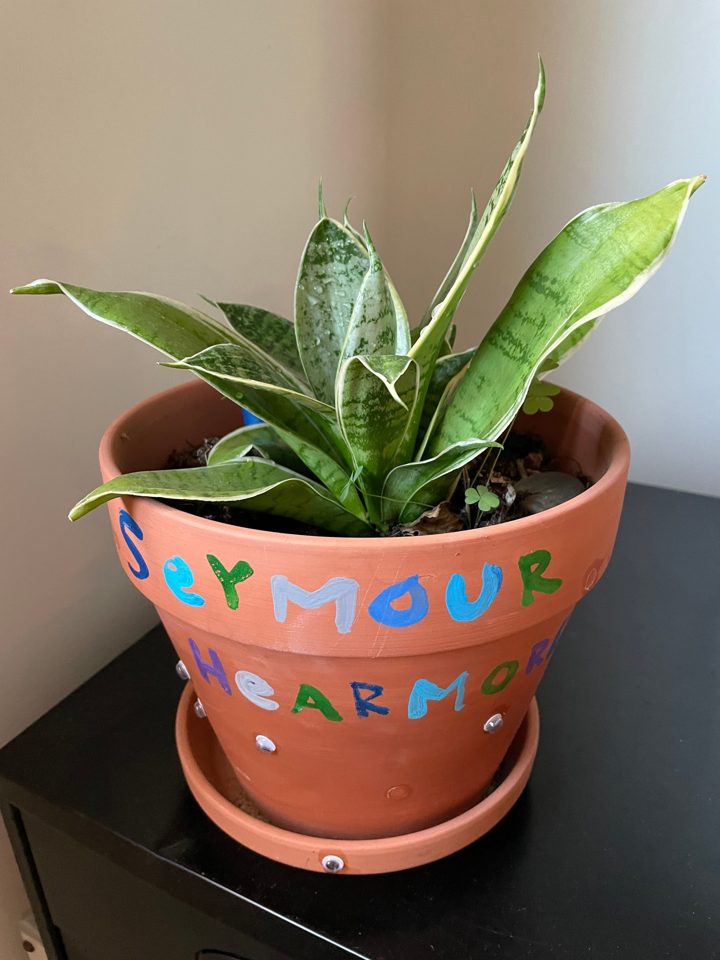
Every plant carries its own living signal, shifting with its inner state and with everything it senses. PlantWave makes that signal audible and visible. Seymour's portrait plays back a recording of his. If you have a PlantWave, clip it to your own plant and play together: gently touch a leaf, speak to it, consciously connect with it, or sit with it quietly, and notice what changes in the light and the sound. What is your plant telling you, as a living being, or as a mirror?
Seymour Hearmore is an ongoing study of plant consciousness and frequency. Not only plants: we are all frequency, energy and vibration, and so is every room we share and everything in it. A coming chapter adds intention, through David R. Hawkins' Map of Consciousness.
Æther/Or's mission is to raise the vibration of this planet, one person, one room, one building at a time.
Under the hood
01The signal
PlantWave, made by Data Garden, lets you hear a plant. Two sensor pads clip onto neighboring leaves and read tiny changes in the plant's electrical resistance. PlantWave graphs those changes as a wave, turns the wave into pitch, and plays it through instruments in its app.
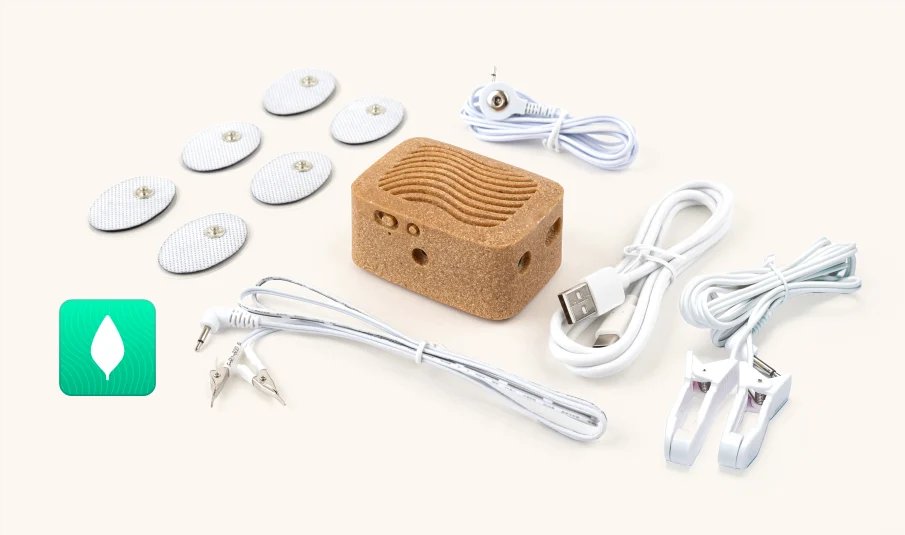
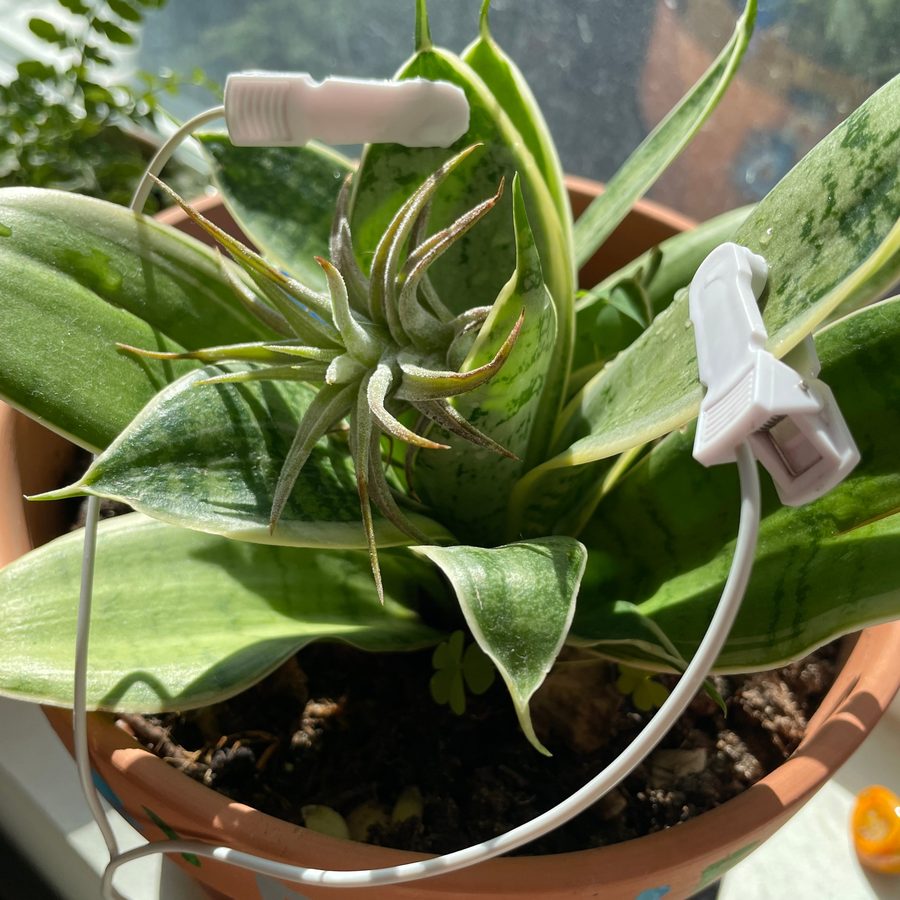
It also sends the signal as MIDI: notes whose pitch follows the wave, and a continuous controller (CC 80) that tracks its level about 13 times a second. The browser reads that MIDI directly through Web MIDI. Nothing is installed or sent. In live mode, Record saves the signal as a JSON file on your computer, the same format as Seymour's recording here.
02The portrait
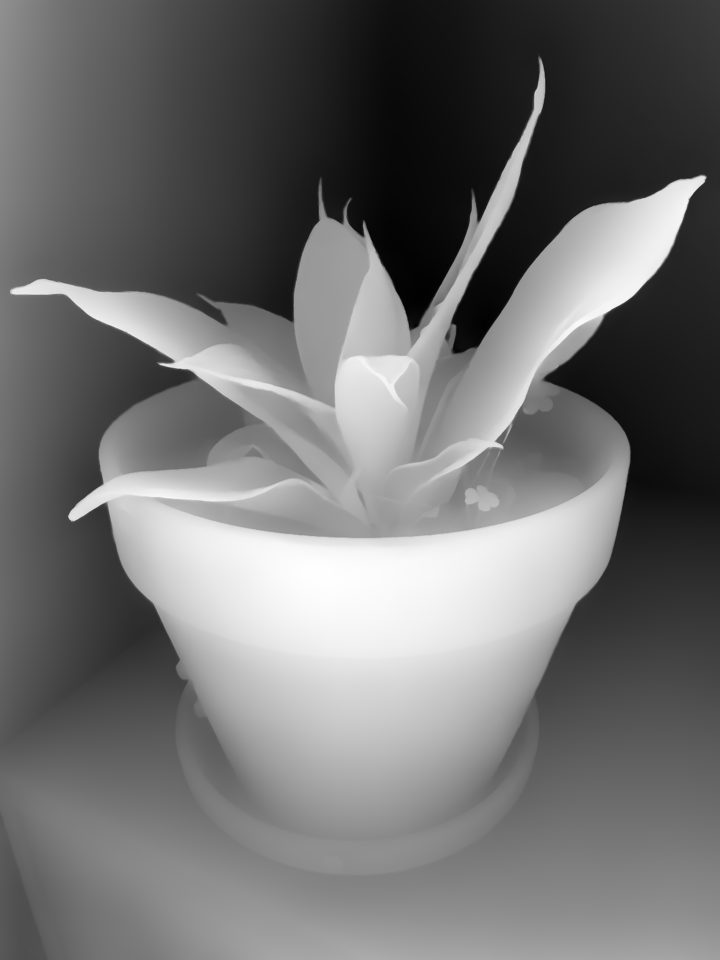
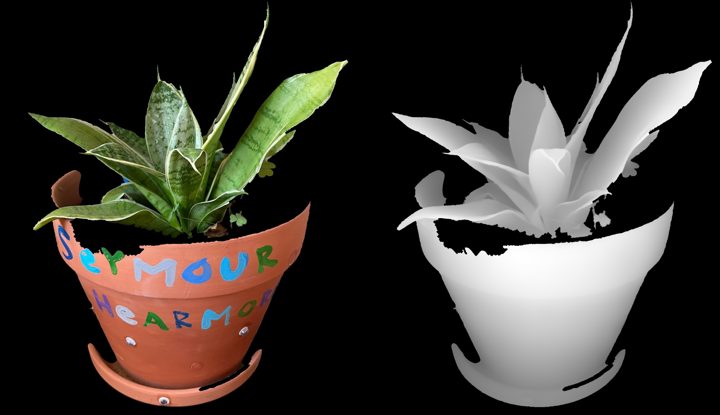
One photo of Seymour runs through Depth Anything V2, a monocular depth model, on the GPU in the browser at 1400 × 1050 instead of its 518-pixel default, for finer leaf edges. A filter guided by the photo snaps the depth edges to the leaves.
03The cutout
A color mask keeps greens, blues and saturated terracotta and drops the beige wall and grey tabletop. Hole-filling restores the pale painted letters. Everything ships as two small images, color and depth, under 400 KB together.
04The cloud
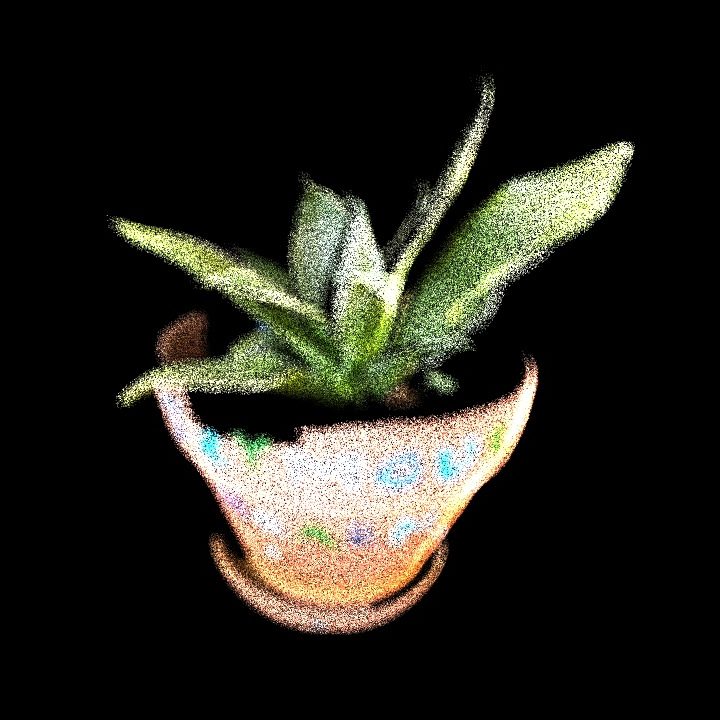
Each kept pixel becomes a point: position from the photo, depth from the model. 420,000 points on desktop, 130,000 on phones, drawn in a custom three.js shader.
05The mapping
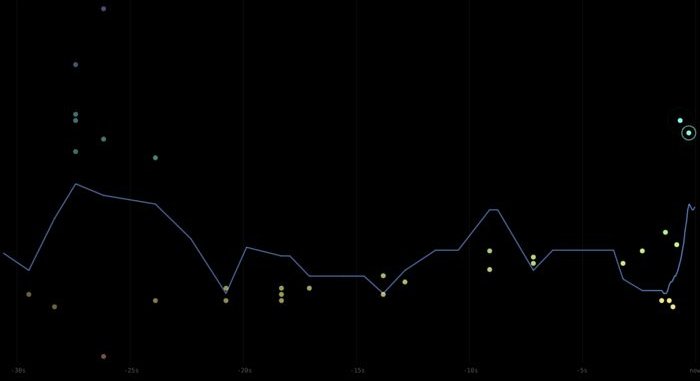
Four readings drive everything. Level sets light and breath. Trend, a fast average against a slow one, sets color: warm while rising, cool while falling. Activity, in notes per minute, sets shimmer. Each note launches a pulse whose height and hue follow its pitch.
06The sound
A Web Audio instrument plays the same data: each note a bell at its own pitch, the level opening a low drone, the trend bending its tuning.
PlantWave by Data Garden. Depth from Depth Anything V2 (Apache-2.0). Rendered with three.js. Made by Æther/Or.